How do we know if our training is really making a difference?
Nick Burnett, Director of Education and Innovation, PRICE Training
Background: the PRICE Impact Measurement Project
Most training organisations are good at the ‘happy sheet’. Participants say they enjoyed the day and feel more confident, and for much of the sector that is where evaluation ends. At PRICE Training we are committed to ensuring our training and consultancy produce impact for the people who receive care and support from the staff we train.
That ambition is hard to test. A confidence rating collected at the end of the day captures people at their highest point of motivation, and it says little about whether someone responds differently on a Tuesday morning or whether the people they support notice the change.
PRICE has been developing an impact measurement project around that question. It is built on the Practice Impact Pathway, a five-stage chain that runs from training, through commitment and behaviour, to organisational outcomes and finally the impact on people’s lives. Any stage can break, so each one needs its own evidence. Return on Learning is the lens at the final stage, asking what changed for the people being supported.
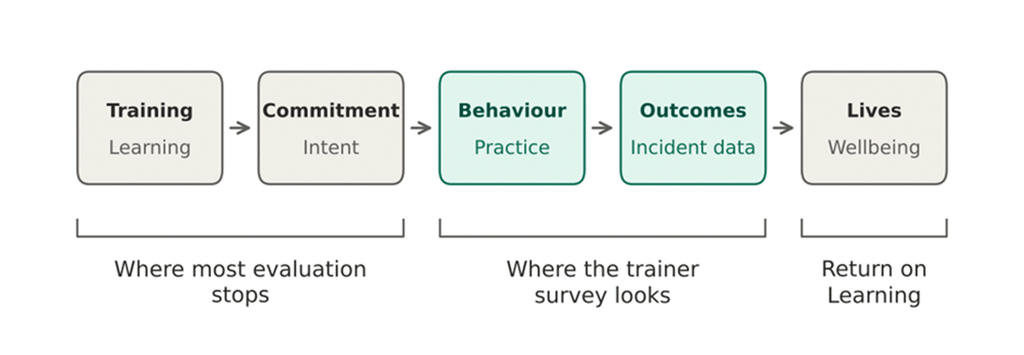
Figure 1. The Practice Impact Pathway and where the survey looks
Two further pieces are being piloted alongside this work: a commitment mechanism at stage two, and baseline and follow-up measures for individual practitioners. The first data to arrive comes from people we have trained, who sit close to stages three and four.
The first data
We have only just started collecting this data. Between September and mid-October 2026, the first 68 people asked these questions completed a short impact survey at their PRICE trainer refresher course. Each of them qualified as a trainer through PRICE and now trains colleagues in the organisation that employs them, so they work across around 50 different services and schools. From here the figures are given as percentages. With a base this small, each response moves a figure by about 1.5 percentage points, and some organisations sent more than one trainer, so responses may describe overlapping experiences. Everything below is an early signal that the full data set will test.
By sector, 63% of responses came from Education and Schools, 31% from Children’s Services, 3% from Health and 3% from Adult Services. Health and Adult Services are too thinly represented for any sector comparison, so none is made here.
Every respondent is employed on site, so each one compared today’s practice with what they saw twelve months ago. Commissioners ask whether training changes what happens to the people being supported. The respondents hold a view few others do, because they hear how colleagues talk about the work and see what the incident records show.
What changed
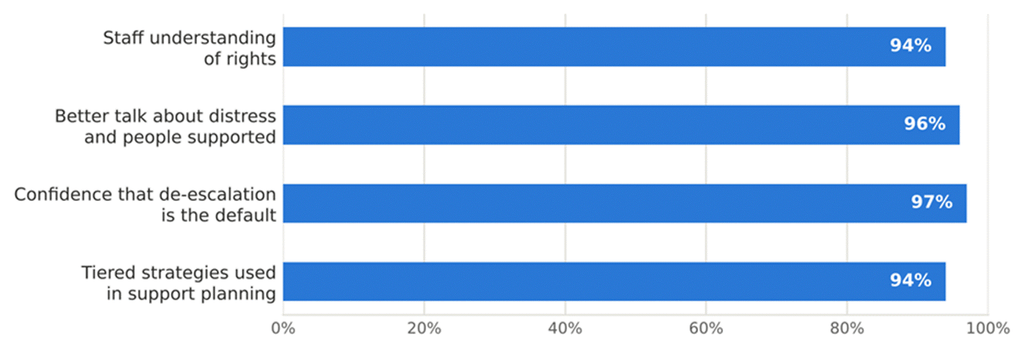
Figure 2. Respondents rating each area as better than twelve months ago
Between 94% and 97% of respondents rated all four areas as better than twelve months ago, with confidence that de-escalation is the default highest at 97%. These items describe how people think and talk about the work. Results this high may sit near a ceiling, a point the limits section below returns to.
Where the picture gets less tidy
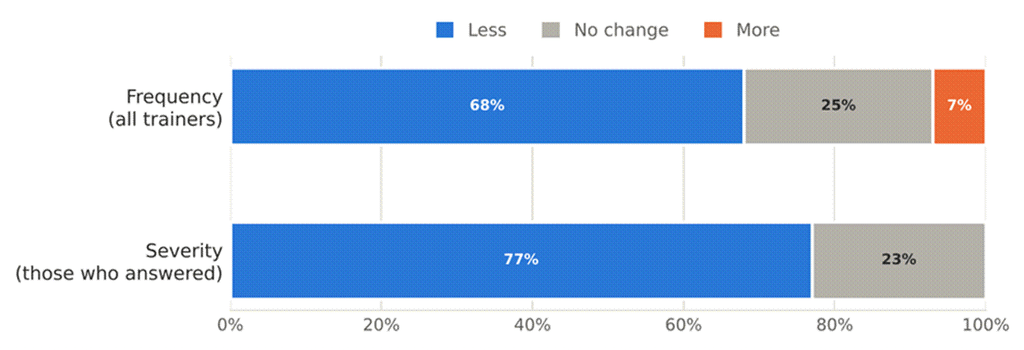
Figure 3. Restrictive practice frequency and severity compared with twelve months ago
The restrictive practice results vary more. On frequency, 68% of respondents reported less, 25% saw no change and 7% reported more. That 7% is five respondents. Severity was answered by 88%, so the severity figures describe those who answered. Among them, 77% said restrictive practices are less severe when they occur, 23% saw no change and none reported an increase. We do not yet know why the remaining 12% did not answer.
All five respondents who reported more frequent restrictive practice also rated understanding of rights, colleague language, de-escalation and tiered strategies as better. A change in people’s needs and circumstances could produce that pattern, and so could more complete recording of incidents. Equally, staff may be finding it hard to apply what they learned, or their organisations may not yet be giving them the support to do so. The survey cannot say which, and the question belongs with those organisations.
Where follow-through needs attention
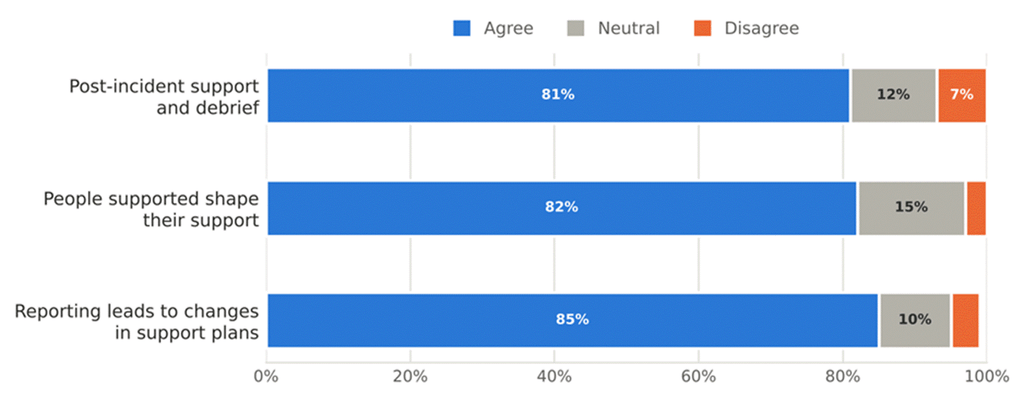
Figure 4. Agreement that post-incident support, the voice of the person supported and reporting are in place. Percentages are rounded, so a row may not total 100%.
The weaker results sit in the agreement items, and they cover practices that are central to rights-led support. Post-incident support and debrief has the lowest agreement at 81% and the highest disagreement at 7%. Agreement runs at 82% for people supported shaping how their support is planned and delivered, and 85% for reporting that leads to real changes in support plans. Between 10% and 15% of respondents chose neutral on each item, which may reflect uncertainty or limited visibility of these practices.
The limits of this evidence
These are the judgements of the people trained by PRICE, and they carry limits that readers should weigh. They are rating the effect of PRICE training, so social desirability is a risk, and respondents who attend refresher courses may be the more engaged part of the workforce. The comparison with twelve months ago relies on memory, and some organisations contributed more than one response.
The survey also cannot establish how much of the reported change came from training, as distinct from everything else happening in the same settings. The baseline and follow-up measures for individual practitioners are designed to test what the respondent view cannot.
The conditions that sustain change
High ratings for understanding and language sit alongside softer results on debrief, the voice of the person supported and follow-through. That pattern invites a question about learning transfer: what happens in the weeks after training, and whether the organisation makes room for it. The commitment mechanism at stage two of the pathway is one place PRICE is testing that question.
What this suggests in practice
- Report frequency and severity together and record any change in how incidents are logged.
- Ask who was offered a debrief last month and who took it up.
- Make the voice of the person supported a standing item at support plan reviews.
- When a number rises, begin by asking what changed for the people being supported.
What would the people you support notice if training was making a difference?
Share this story